2010:Audio Cover Song Identification Results
Contents
Introduction
This year, we ran Audio Cover Song (ACS) Identfication with two datasets: Mixed Collection and Sapp's Mazurka Collection.
Mixed Collection Information
This is the "original" ACS collection. Within the 1000 pieces in the Audio Cover Song database, there are embedded 30 different "cover songs" each represented by 11 different "versions" for a total of 330 audio files (16bit, monophonic, 22.05khz, wav). The "cover songs" represent a variety of genres (e.g., classical, jazz, gospel, rock, folk-rock, etc.) and the variations span a variety of styles and orchestrations.
Using each of these cover song files in turn as as the "seed/query" file, we will examine the returned lists of items for the presence of the other 10 versions of the "seed/query" file.
Sapp's Mazurka Collection Information
In addition to our original ACS dataset, we used the Mazurka.org dataset put together by Craig Sapp. We randomly chose 11 versions from 49 mazurkas and ran it as a separate ACS subtask. Systems returned a distance matrix of 539x539 from which we located the ranks of each of the associated cover versions.
General Legend
| Sub code | Submission name | Abstract | Contributors |
|---|---|---|---|
| MHRAF1 | Simbals_Cover_Songs | Benjamin Martin, Pierre Hanna, Matthias Robine, Julien Allali, Pascal Ferraro | |
| MOD1 | Applying Text-Based IR Techniques to Cover Song Identification | Nicola Montecchio, Nicola Orio, Emanuele Di Buccio | |
| RMHAR1 | Cover | Thomas Rocher, Benjamin Martin, Pierre Hanna, Julien Allali, Matthias Robine, Pascal Ferraro |
Results
Mixed Collection
Summary Results
| MHRAF1 | MOD1 | RMHAR1 | |
|---|---|---|---|
| Total number of covers identified in top 10 | 780.00 | 471.00 | 908.00 |
| Mean number of covers identified in top 10 (average performance) | 2.36 | 1.43 | 2.75 |
| Mean (arithmetic) of Avg. Precisions | 0.24 | 0.15 | 0.29 |
| Mean rank of first correctly identified cover | 28.16 | 39.34 | 38.35 |
Number of Correct Covers at Rank X Returned in Top Ten
| Rank | MHRAF1 | MOD1 | RMHAR1 |
|---|---|---|---|
| 1 | 94 | 106 | 159 |
| 2 | 101 | 82 | 139 |
| 3 | 105 | 57 | 115 |
| 4 | 88 | 53 | 98 |
| 5 | 92 | 37 | 93 |
| 6 | 70 | 34 | 79 |
| 7 | 64 | 31 | 75 |
| 8 | 58 | 29 | 56 |
| 9 | 59 | 26 | 51 |
| 10 | 49 | 16 | 43 |
| Total | 780 | 471 | 908 |
Average Performance per Query Group
| Group | MHRAF1 | MOD1 | RMHAR1 |
|---|---|---|---|
| 1 | 0.25 | 0.01 | 0.04 |
| 2 | 0.09 | 0.01 | 0.12 |
| 3 | 0.01 | 0.08 | 0.02 |
| 4 | 0.03 | 0.03 | 0.02 |
| 5 | 0.02 | 0.01 | 0.01 |
| 6 | 0.20 | 0.32 | 0.25 |
| 7 | 0.87 | 0.02 | 0.89 |
| 8 | 0.82 | 0.74 | 0.47 |
| 9 | 0.47 | 0.21 | 0.62 |
| 10 | 0.12 | 0.17 | 0.34 |
| 11 | 0.36 | 0.02 | 0.40 |
| 12 | 0.23 | 0.03 | 0.28 |
| 13 | 0.68 | 0.18 | 0.98 |
| 14 | 0.08 | 0.02 | 0.31 |
| 15 | 0.38 | 0.02 | 0.98 |
| 16 | 0.01 | 0.07 | 0.02 |
| 17 | 0.75 | 0.15 | 0.55 |
| 18 | 0.70 | 0.28 | 0.73 |
| 19 | 0.28 | 0.31 | 0.80 |
| 20 | 0.03 | 0.02 | 0.04 |
| 21 | 0.11 | 0.02 | 0.30 |
| 22 | 0.06 | 0.03 | 0.03 |
| 23 | 0.42 | 0.71 | 0.15 |
| 24 | 0.25 | 0.73 | 0.53 |
| 25 | 0.56 | 0.02 | 0.63 |
| 26 | 0.03 | 0.05 | 0.02 |
| 27 | 0.01 | 0.38 | 0.01 |
| 28 | 0.33 | 0.23 | 0.05 |
| 29 | 0.11 | 0.01 | 0.14 |
| 30 | 0.12 | 0.03 | 0.11 |
Friedman's Test for Significant Differences
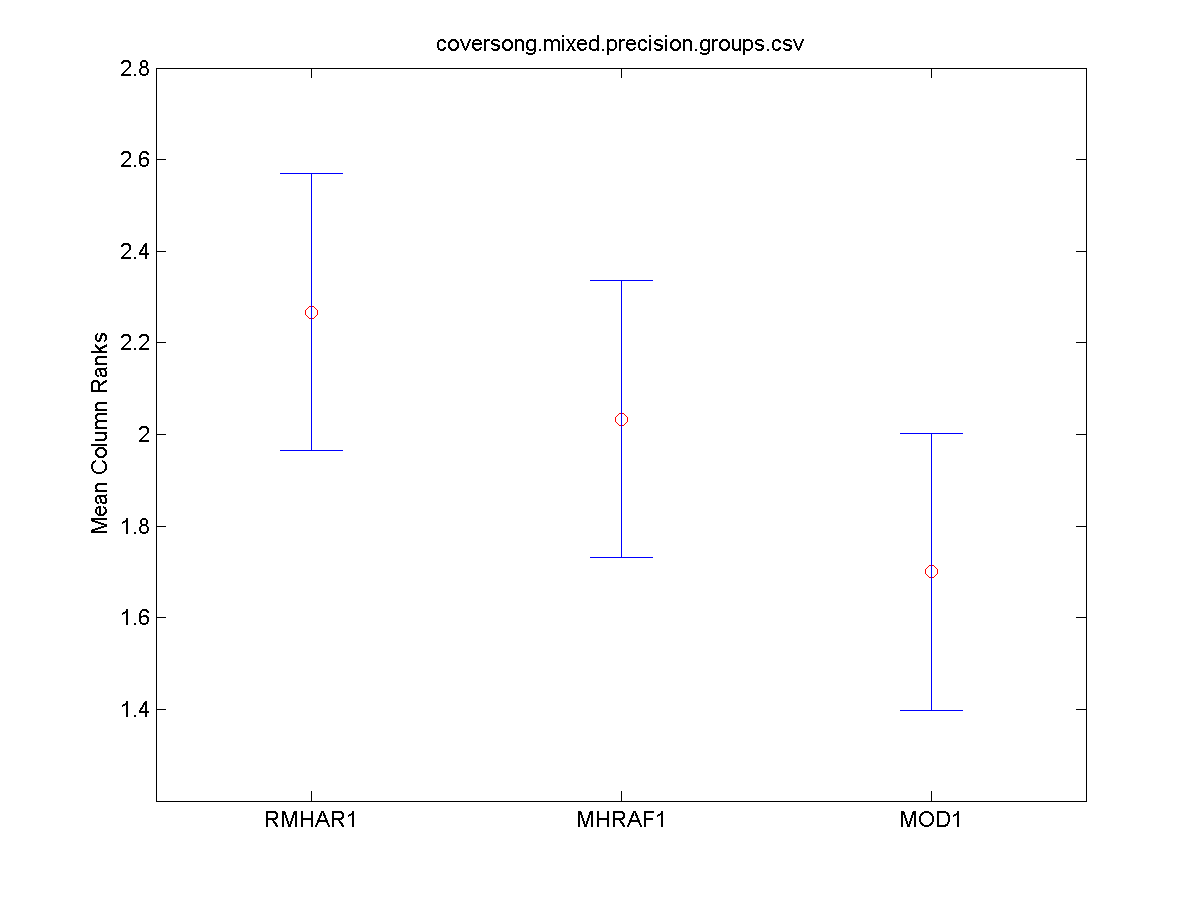
The Friedman test was run in MATLAB against the Average Precision summary data over the 30 song groups.
Command: [c,m,h,gnames] = multcompare(stats, 'ctype', 'tukey-kramer','estimate', 'friedman', 'alpha', 0.05);
| TeamID | TeamID | Lowerbound | Mean | Upperbound | Significance |
|---|---|---|---|---|---|
| RMHAR1 | MHRAF1 | -0.37 | 0.23 | 0.84 | FALSE |
| RMHAR1 | MOD1 | -0.04 | 0.57 | 1.17 | FALSE |
| MHRAF1 | MOD1 | -0.27 | 0.33 | 0.94 | FALSE |
Run Times
TBA
Sapp's Mazuraka Collection
Summary results
| MHRAF1 | MOD1 | RMHAR1 | |
|---|---|---|---|
| Total number of covers identified in top 10 | 4071.00 | 3255.00 | 4279.00 |
| Mean number of covers identified in top 10 (average performance) | 7.55 | 6.04 | 7.94 |
| Mean (arithmetic) of Avg. Precisions | 0.79 | 0.63 | 0.82 |
| Mean rank of first correctly identified cover | 2.09 | 3.03 | 3.42 |
Number of Correct Covers at Rank X Returned in Top Ten
| Rank | MHRAF1 | MOD1 | RMHAR1 |
|---|---|---|---|
| 1 | 446 | 489 | 496 |
| 2 | 450 | 462 | 495 |
| 3 | 446 | 432 | 473 |
| 4 | 445 | 406 | 461 |
| 5 | 432 | 366 | 458 |
| 6 | 440 | 325 | 452 |
| 7 | 411 | 273 | 423 |
| 8 | 365 | 229 | 387 |
| 9 | 344 | 158 | 345 |
| 10 | 292 | 115 | 289 |
| Total | 4071 | 3255 | 4279 |
Average Performance per Query Group
| Group | MHRAF1 | MOD1 | RMHAR1 |
|---|---|---|---|
| 1 | 0.88 | 0.85 | 1 |
| 2 | 0.85 | 0.98 | 1 |
| 3 | 0.88 | 0.61 | 0.88 |
| 4 | 0.38 | 0.07 | 0.02 |
| 5 | 0.88 | 0.78 | 0.33 |
| 6 | 0.89 | 0.52 | 1 |
| 7 | 0.79 | 0.83 | 1 |
| 8 | 0.72 | 0.65 | 0.45 |
| 9 | 0.81 | 0.13 | 0.22 |
| 10 | 0.99 | 0.56 | 1 |
| 11 | 0.72 | 1.00 | 1 |
| 12 | 0.60 | 0.88 | 0.66 |
| 13 | 0.98 | 0.74 | 1 |
| 14 | 0.77 | 0.90 | 0.93 |
| 15 | 1 | 0.72 | 0.99 |
| 16 | 0.98 | 0.89 | 0.87 |
| 17 | 0.70 | 0.85 | 1 |
| 18 | 0.88 | 0.50 | 0.72 |
| 19 | 0.88 | 0.70 | 0.29 |
| 20 | 1 | 0.91 | 1 |
| 21 | 0.79 | 0.58 | 1 |
| 22 | 0.97 | 0.96 | 0.91 |
| 23 | 0.90 | 0.75 | 0.85 |
| 24 | 0.90 | 0.76 | 0.80 |
| 25 | 0.93 | 0.53 | 1 |
| 26 | 0.66 | 0.72 | 0.71 |
| 27 | 0.67 | 0.61 | 0.90 |
| 28 | 0.61 | 0.30 | 0.39 |
| 29 | 0.31 | 0.29 | 0.37 |
| 30 | 0.99 | 0.15 | 0.97 |
| 31 | 0.93 | 0.62 | 1 |
| 32 | 0.91 | 1 | 1 |
| 33 | 0.96 | 0.64 | 1 |
| 34 | 0.81 | 0.56 | 0.45 |
| 35 | 0.97 | 0.72 | 1 |
| 36 | 0.93 | 0.70 | 1 |
| 37 | 0.86 | 0.54 | 1 |
| 38 | 0.73 | 0.58 | 0.93 |
| 39 | 0.94 | 0.20 | 0.86 |
| 40 | 1 | 0.71 | 1 |
| 41 | 0.96 | 0.92 | 0.92 |
| 42 | 0.25 | 0.35 | 0.14 |
| 43 | 0.79 | 0.56 | 0.76 |
| 44 | 0.93 | 0.85 | 0.76 |
| 45 | 0.16 | 0.25 | 0.07 |
| 46 | 0.59 | 0.39 | 0.83 |
| 47 | 0.74 | 0.97 | 0.99 |
| 48 | 0.80 | 0.66 | 0.95 |
| 49 | 0.90 | 0.43 | 0.78 |
Friedman's Test for Significant Differences
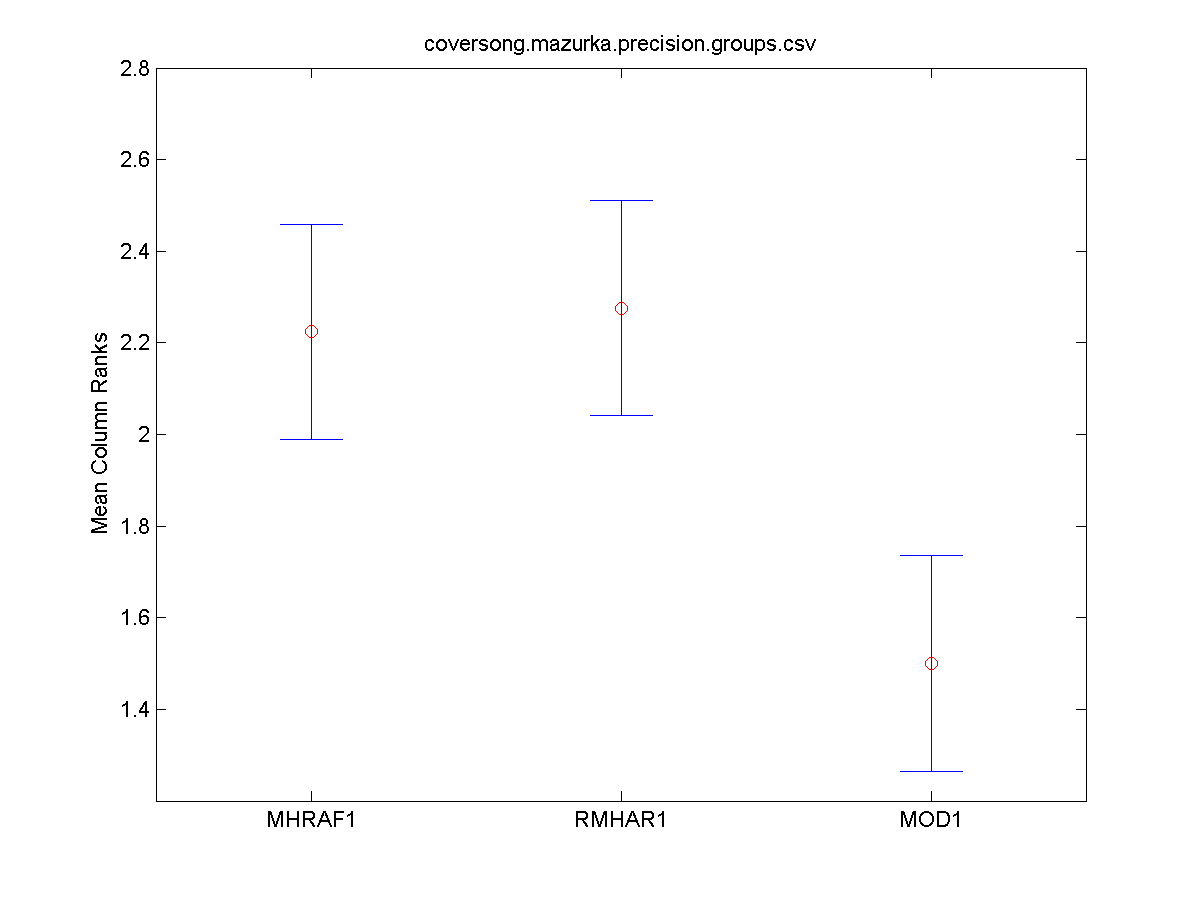
The Friedman test was run in MATLAB against the Average Precision summary data over the 30 song groups.
Command: [c,m,h,gnames] = multcompare(stats, 'ctype', 'tukey-kramer','estimate', 'friedman', 'alpha', 0.05);
| TeamID | TeamID | Lowerbound | Mean | Upperbound | Significance |
|---|---|---|---|---|---|
| MHRAF1 | RMHAR1 | -0.5209 | -0.0510 | 0.4188 | FALSE |
| MHRAF1 | MOD1 | 0.2546 | 0.7245 | 1.1944 | TRUE |
| RMHAR1 | MOD1 | 0.3056 | 0.7755 | 1.2454 | TRUE |
Run Times
TBA
Individual Results Files
Mixed Collection
Average Precision by Query
MHRAF1 : Benjamin Martin et al.
MOD1 : Nicola Montecchio et al.
RMHAR1 : Thomas Rocher et al.
Rank Lists
MHRAF1 : Benjamin Martin et al.
MOD1 : Nicola Montecchio et al.
RMHAR1 : Thomas Rocher et al.
Sapp's Mazurka Collection
Average Precision by Query
MHRAF1 : Benjamin Martin et al.
MOD1 : Nicola Montecchio et al.
RMHAR1 : Thomas Rocher et al.
Rank Lists
MHRAF1 : Benjamin Martin et al.
MOD1 : Nicola Montecchio et al.
RMHAR1 : Thomas Rocher et al.

